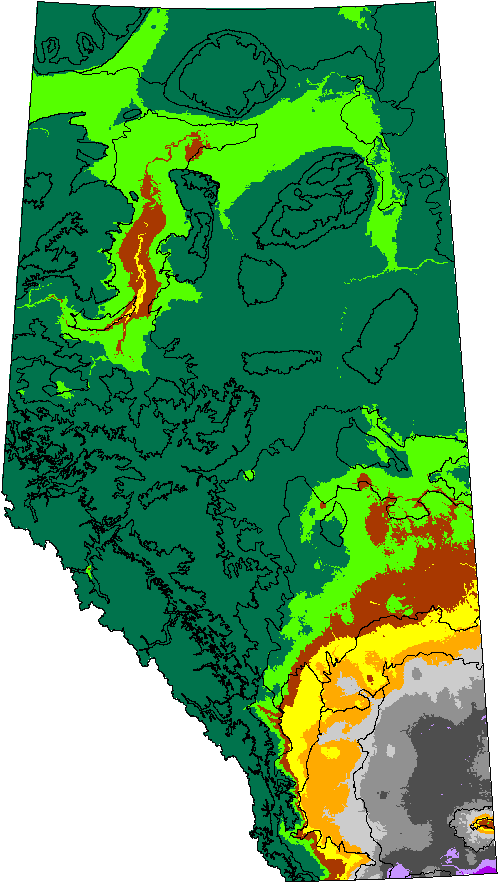
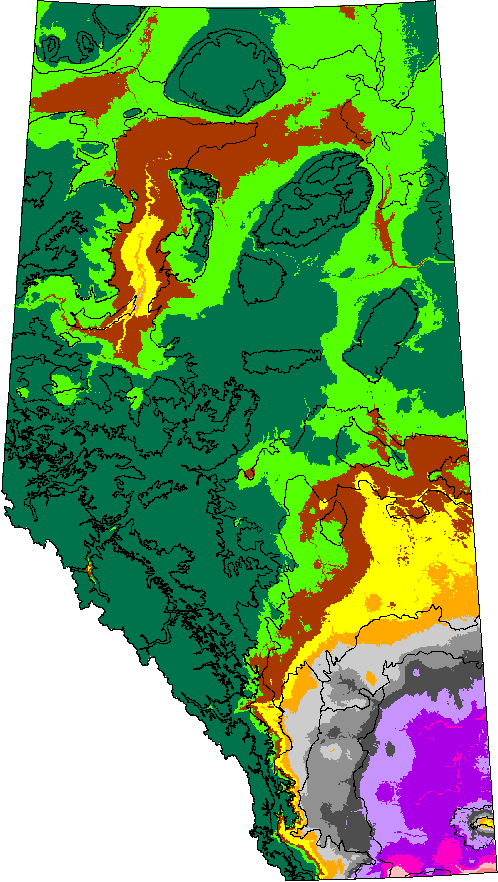
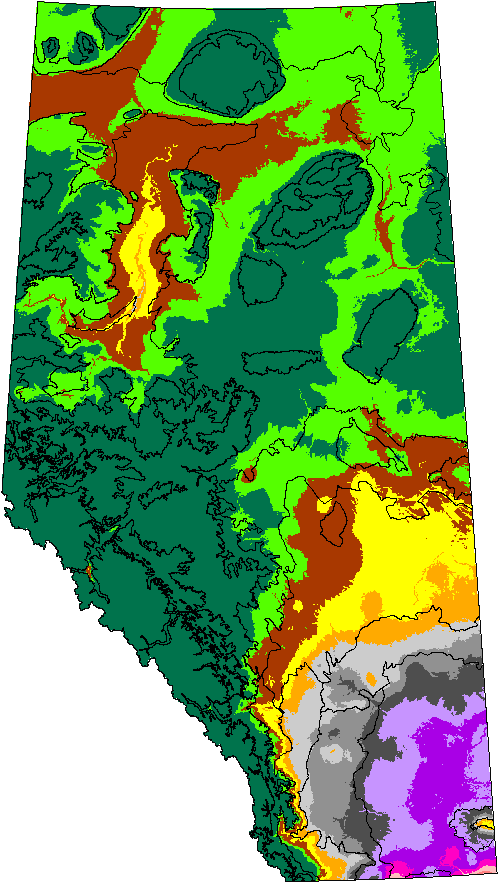
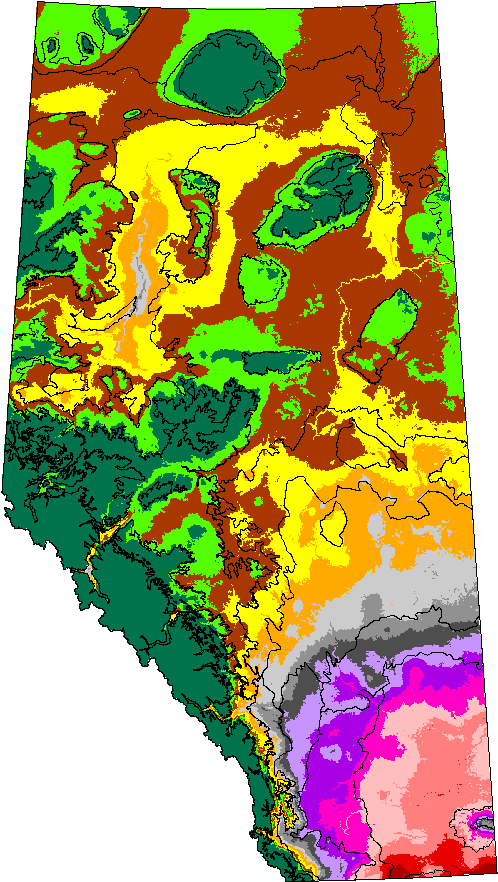
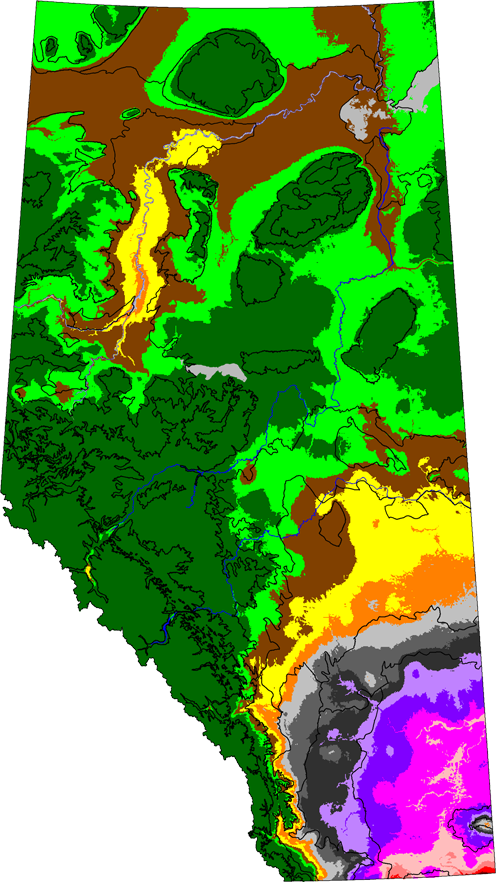
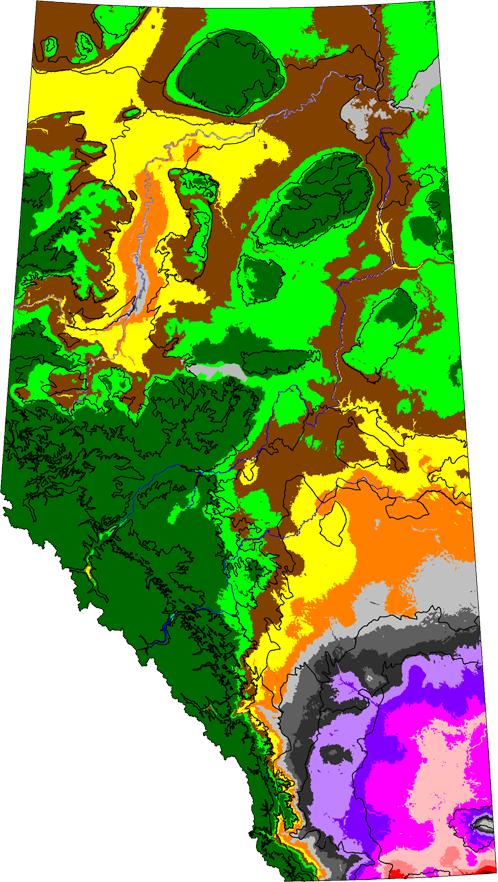
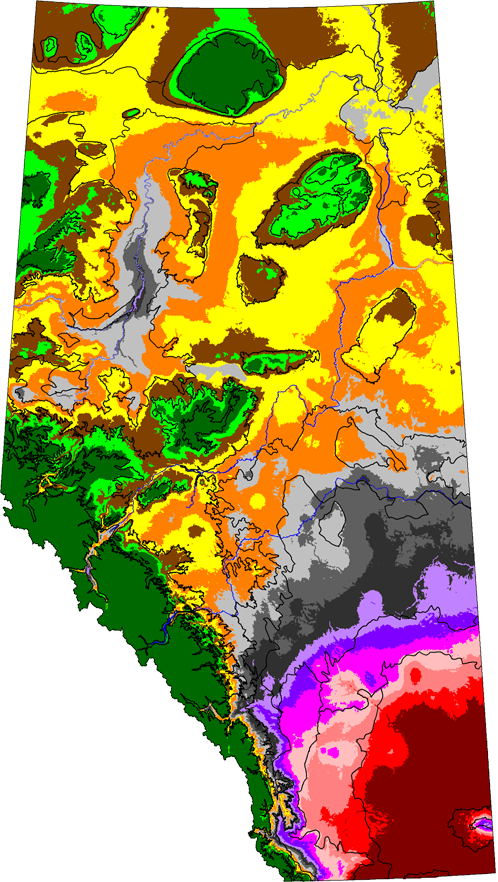
Climate Moisture Index
Explore the projections for the climate moisture index in Alberta under future conditions in this map gallery. The climate moisture index provides an index of moisture available to support plant growth on an annual basis. Three future scenarios represent different assumptions about the rate of future climate change. The data used to create the maps and regional data that include the northern US are also available for download.
These maps are from the report Alberta’s Natural Subregions under a Changing Climate: Past, Present and Future (Schneider 2013).
GET ALBERTA DATAGET ALBERTA & US DATADOWNLOAD REPORT